
SPX6900 Explodes 54% In Past Week: Is $SPX About To Reclaim ATH?

SPX6900, a meme token parodying the S&P 500, surged ~54% this week to trade around $1, pushing it into CoinMarketCap’s top 100 with a market cap above $900M; breakouts, heavy volume and rising futures interest signal strong momentum alongside elevated risk.
- Technical setup: Broke key resistance, testing the $1 psychological level; support sits near $0.85–$0.90 (0.618), with upside targets at $1.32 and $1.77.
- Market traction: Top-100 market cap (> $900M) and heavy 24h volume (~$45M) point to mixed retail and institutional demand.
- Risk profile: Futures open interest (~$53.4M) implies institutional conviction but raises liquidation and volatility risk; watch a decisive $1 breakout or failure.
SPX6900 (SPX) has spiked by 54.42% over the past week, with the meme token currently trading around $1.01. This token, which parodies the S&P 500 index with its ‘6900 is more than 500’ slogan, is showing strong technical momentum as it goes in and out of the $1 level.
Currently ranked within the top 100 on CoinMarketCap with a market cap of over $900million, the meme coin is capturing significant attention from both retail traders and institutional players.
What is SPX6900?
SPX6900 is a meme token that claims to be an alternative, satirically, to traditional financial indices. The project suggests that ‘6900 is more than 500’, directly parodying the famous S&P 500 stock market index. It was launched in 2023 and has built a vibrant community through different social media platforms.
According to data from CoinMarketCap, the token has a total supply of one billion SPX tokens, with 930.99m currently in circulation . In the last 24 hours, the token has seen approximately 93% in volume, with $45m recorded.
SPX analysis shows strong momentum
Analysis of the SPX on TradingView shows the token displaying several bullish signs. The charts show that it has broken above key resistance levels and is around the crucial $1.00 psychological barrier.
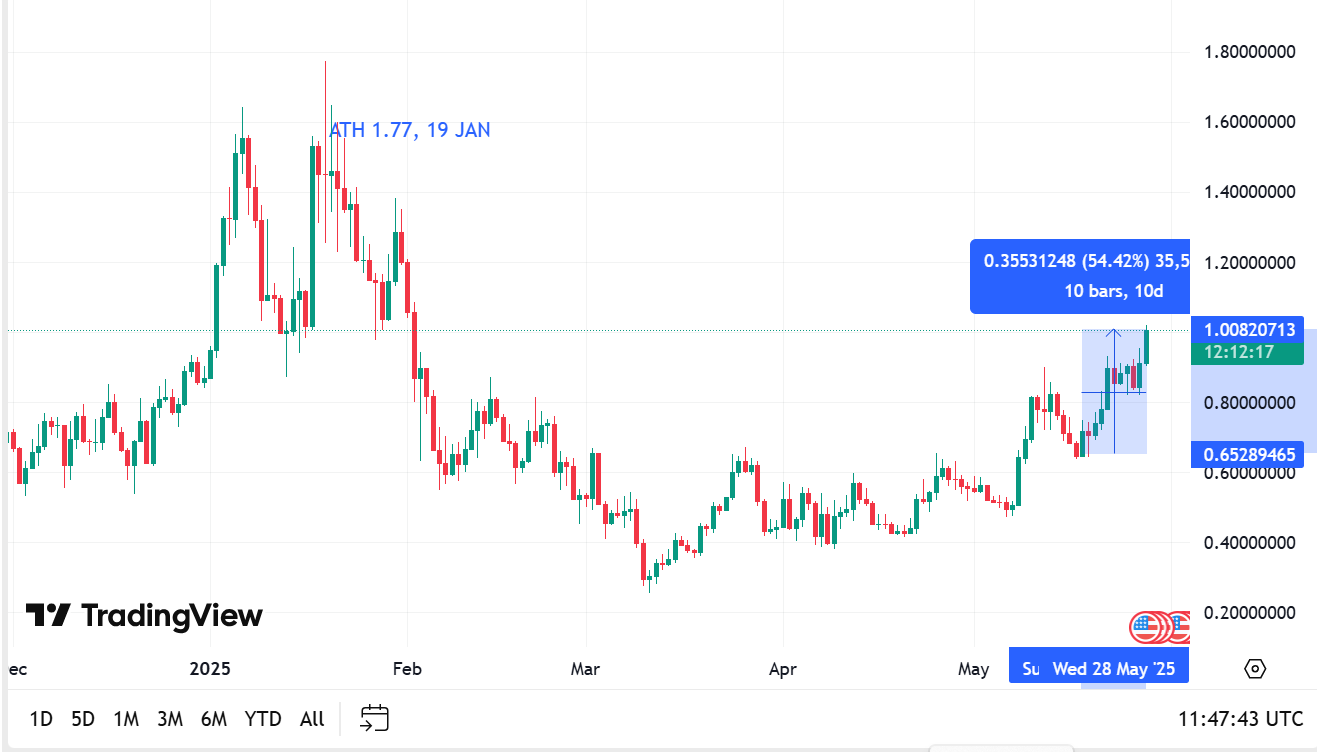
The 54% weekly gain represents a breakout from previous consolidation levels it witnessed after hitting an all-time high of $1.77 on 19 January 2025. Also, the analysis shows SPX6900 testing important Fibonacci retracement levels and appears to be finding support around the 0.618 level ($0.90) and could target the 1.618 extensions near $1.32 if the momentum continues.
Key technical levels to watch
The $1.00 level represents a key psychological resistance level, and breaking above this could trigger significant momentum as round numbers often attract retail buying. Key support exists around $0.85-$0.90, corresponding to recent consolidation areas and Fibonacci levels, and this zone has held during recent pullbacks.
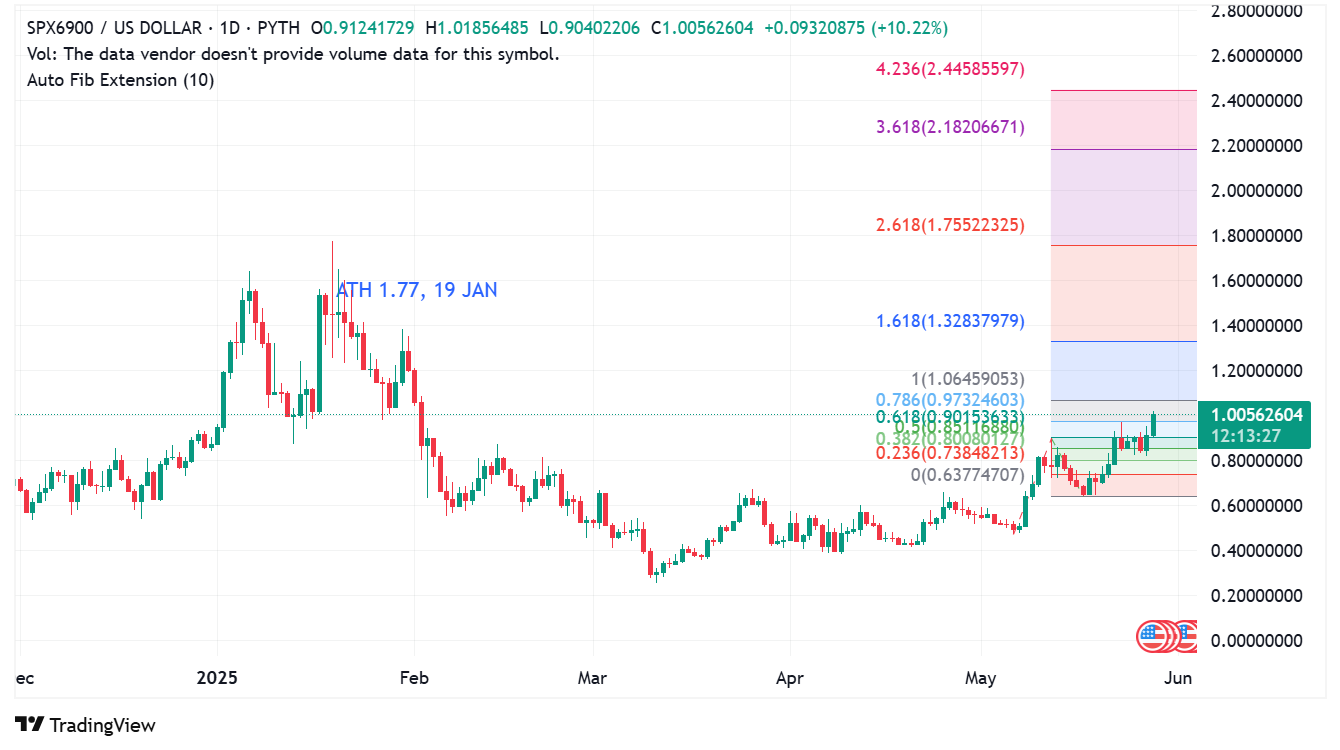
If SPX6900 breaks above $1.00 convincingly, technical analysis suggests potential targets at $1.32 (1.618 Fibonacci extension) and eventually a retest of the January high at $1.77.
More interest in SPX?
Analysis of the SPX6900 open interest chart on Coinglass reveals a recent increase in interest from institutional investors. The chart shows a climb to $53.41m in futures open interest, which is the highest that has been seen in the year.
The steady climb in open interest and price suggests this isn’t just retail fear of missing out (FOMO ) but potentially includes institutional participation.
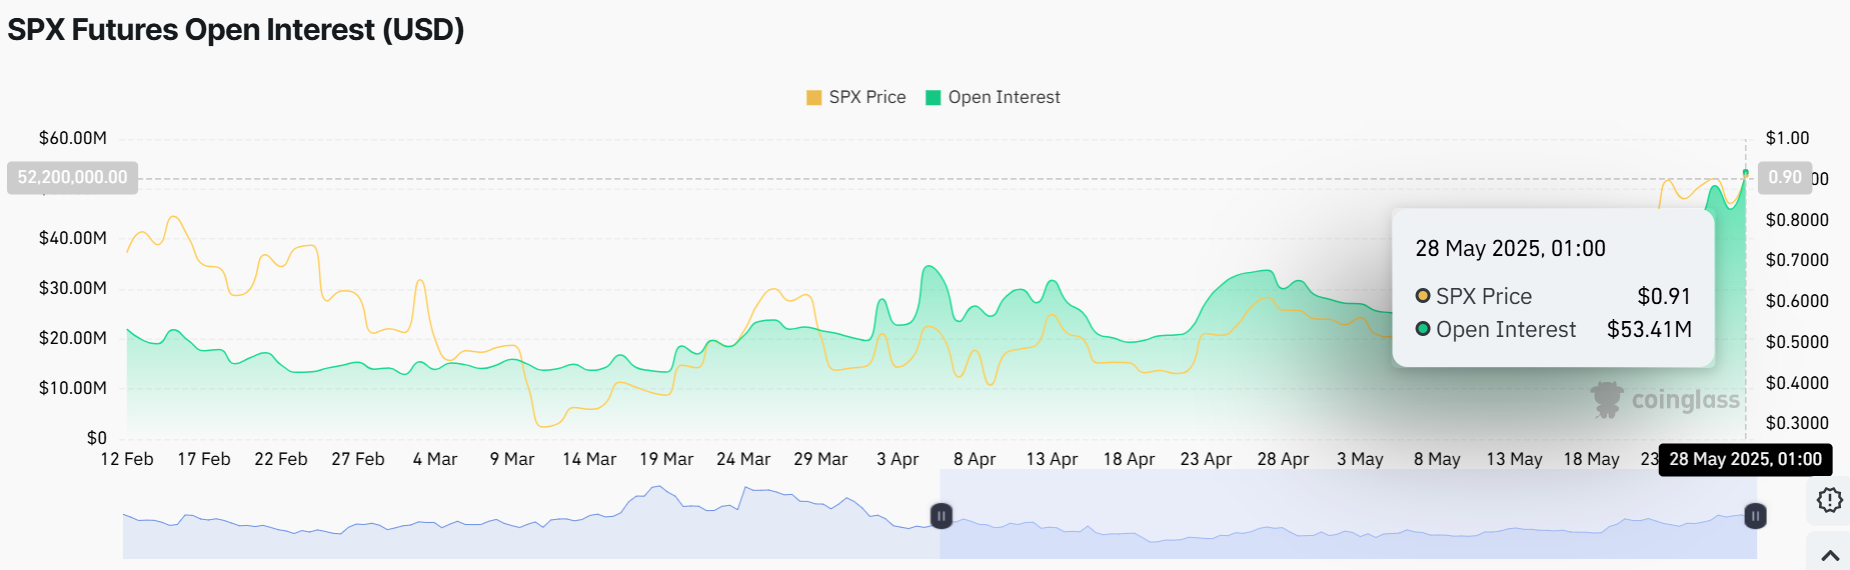
High open interest combined with rising prices typically indicates strong conviction among traders but also means increased volatility risk, as large position liquidations could trigger price movements in either direction.
The coming days will be crucial for the ‘SPX 500 alternative’. However, with the surge seen in the current trading session, there are bound to be some corrections, but what happens after that will determine the strength of the trend.
We're sorry you did not find what you were looking for. Please select the reason this article was not helpful.

