
Solana vs XRP: Is SOL Poised For Reversal After Months Of Weakness?

Realized‑capital metrics and price action point to a potential inflection for Solana, as 30‑day realized cap has crossed above XRP and accumulation indicators signal a rounded bottom with $150–160 support.
- Capital rotation: Glassnode shows SOL’s 30‑day realized cap turning positive vs XRP, indicating fresh inflows after months of underperformance.
- Technical setup: Rounded bottom, positive Chaikin Money Flow and $150–160 support with near resistance at $185; a break could target $200–220.
- Key confirmation: Continued realized‑cap improvement and holding $150 support are required to validate sustained Q2 upside; reversal would weaken the thesis.
Solana (SOL) may be setting up for a significant turnaround, according to realized capitalization data, compared to XRP.
This key metric shift could signal an important inflection point for SOL’s price trajectory. Trading at around $170.14 after dropping 3.71%, SOL showed promising signs beneath the surface.
Realized cap divergence shows momentum shift
A Glassnode chart tracking 30-day change in realized capitalization revealed a clear pattern shift between SOL and XRP starting in early May.
Both cryptocurrencies showed positive realized cap growth from January through mid-February, but Solana turned negative in late February and stayed well below XRP through April.
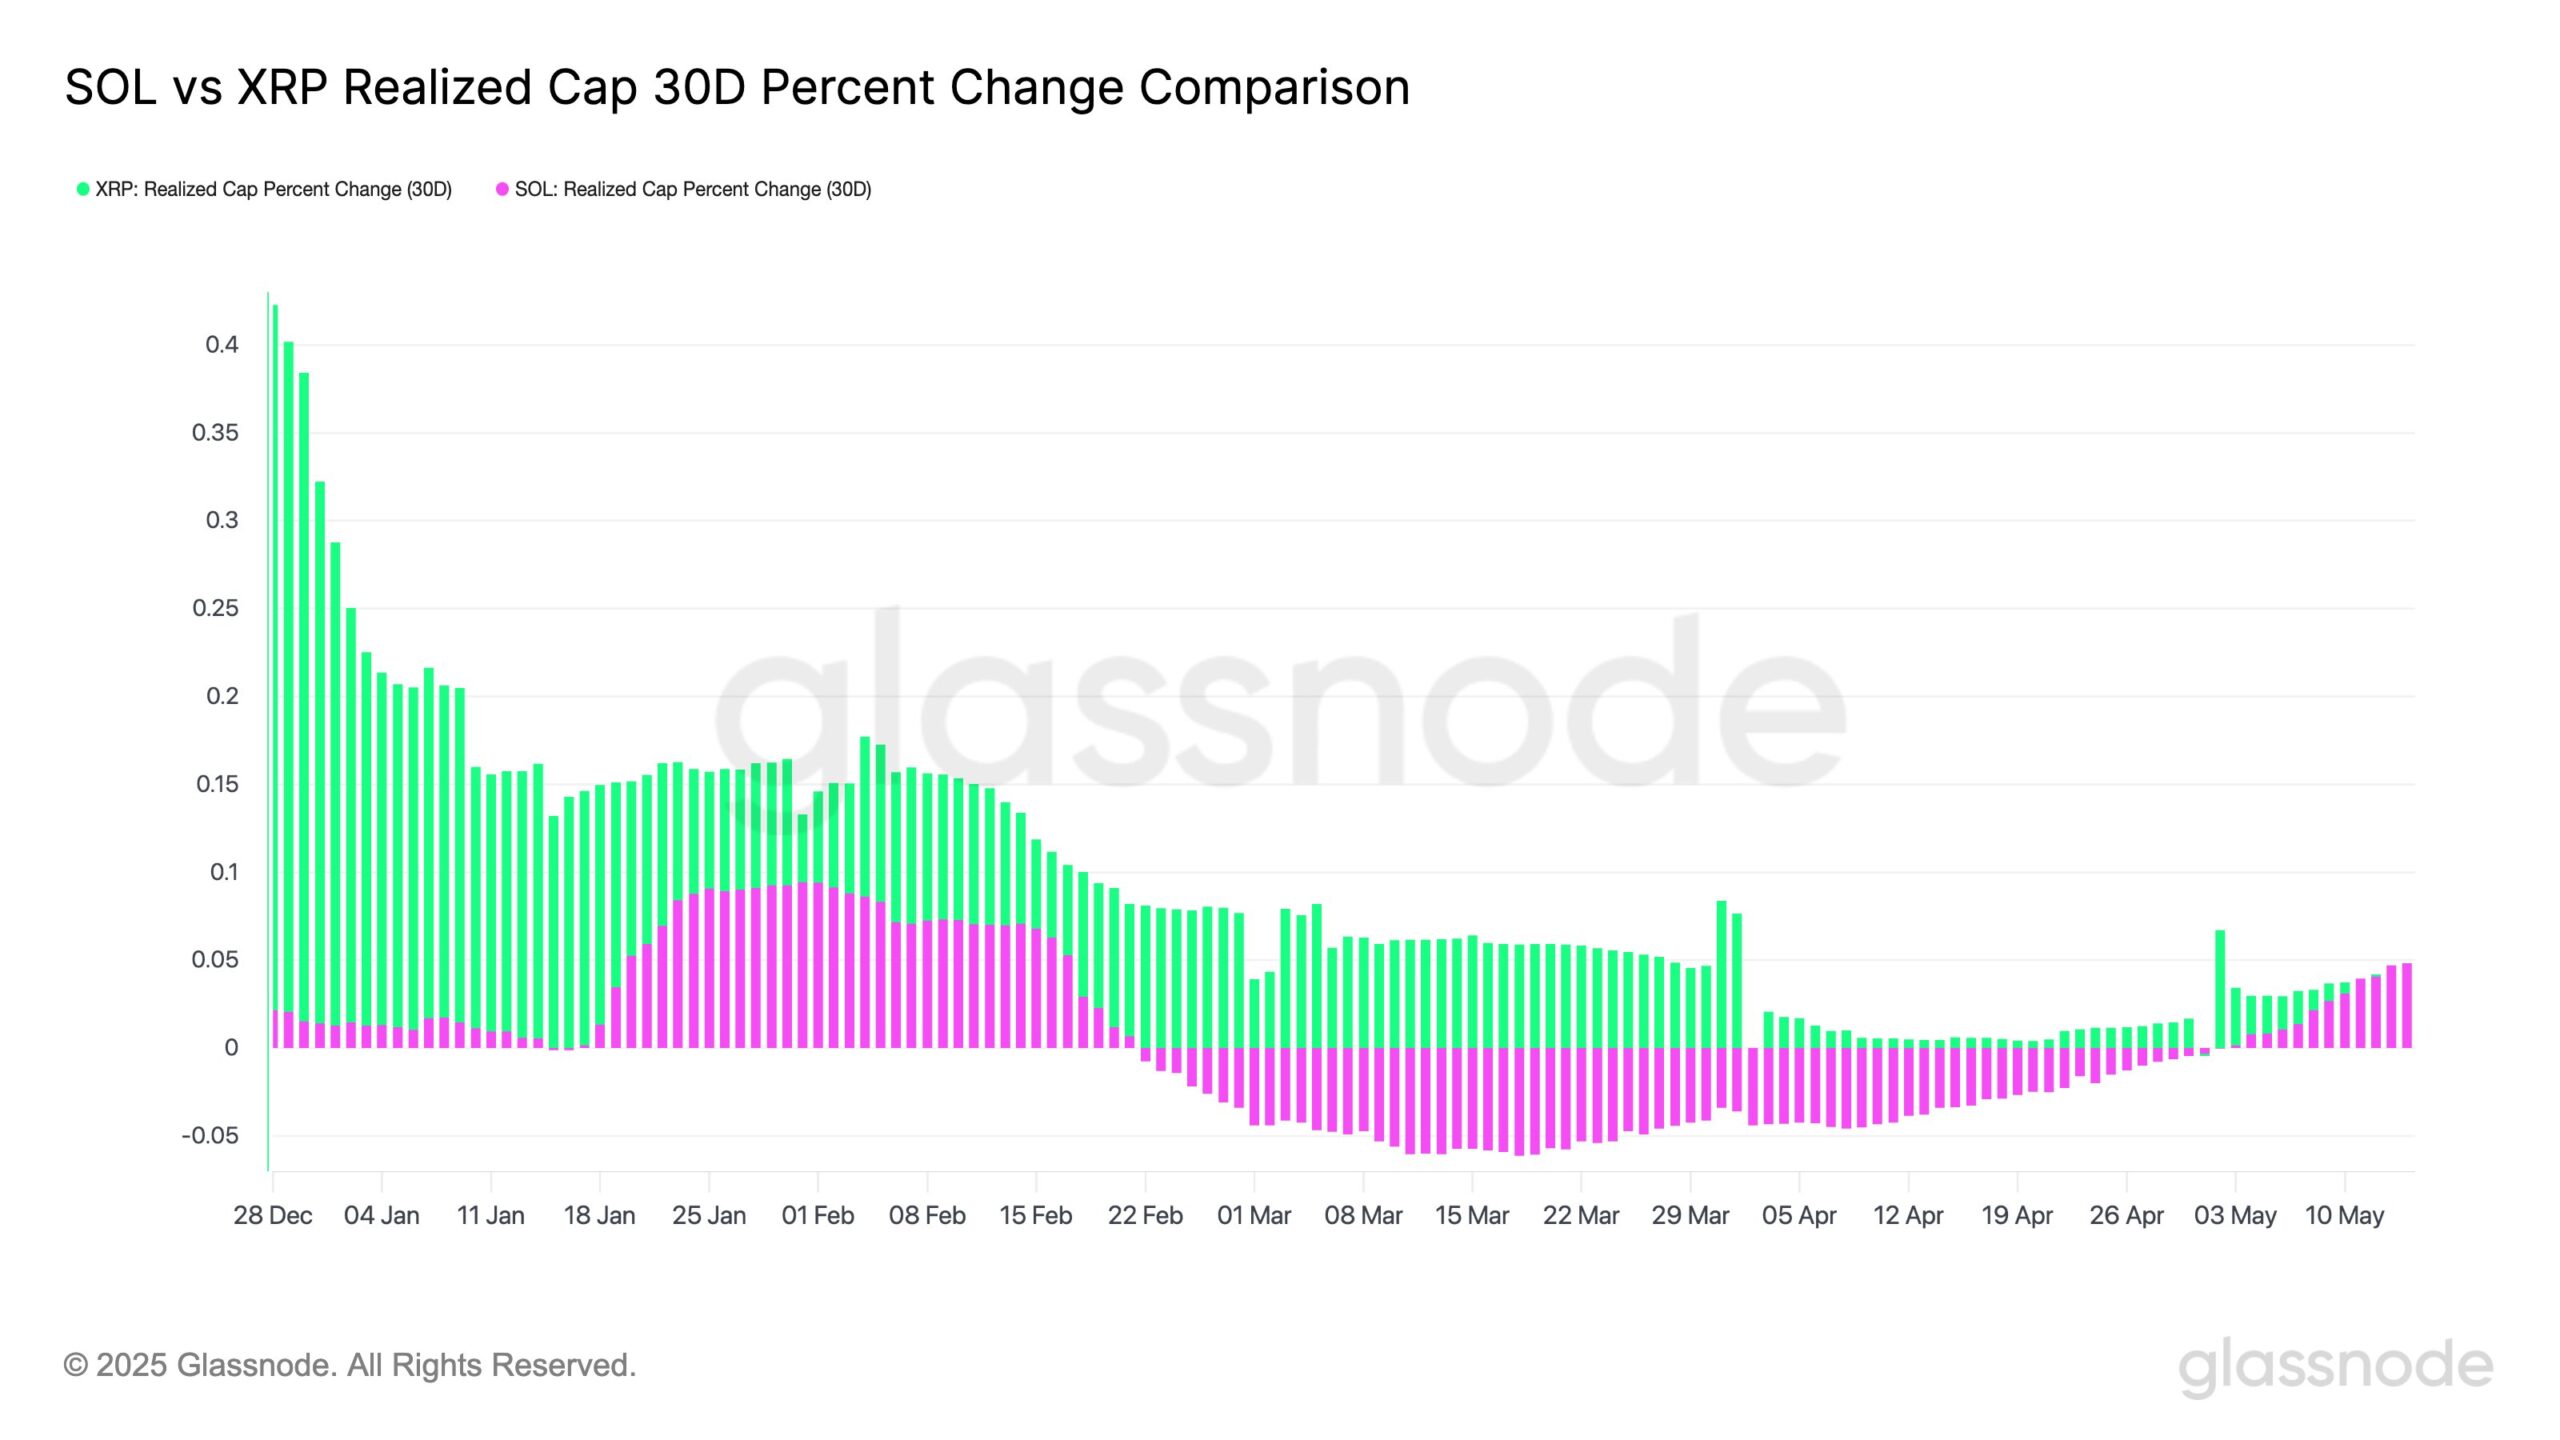
This extended period of SOL’s realized cap underperformance indicated new capital heavily favored XRP over SOL during most of Q1 and early Q2.
However, the recent convergence and crossover in early May suggests this trend is flipping, with Solana’s realized cap growth turning positive while XRP’s remains flat.
Price chart confirms the shift
TradingView data backs up this emerging trend. SOL has formed a rounded bottom through April and early May after sliding from its January peak of around $270.
The Chaikin Money Flow (CMF) indicator has stayed positive since mid-April and was at 0.16, confirming steady accumulation despite price swings.
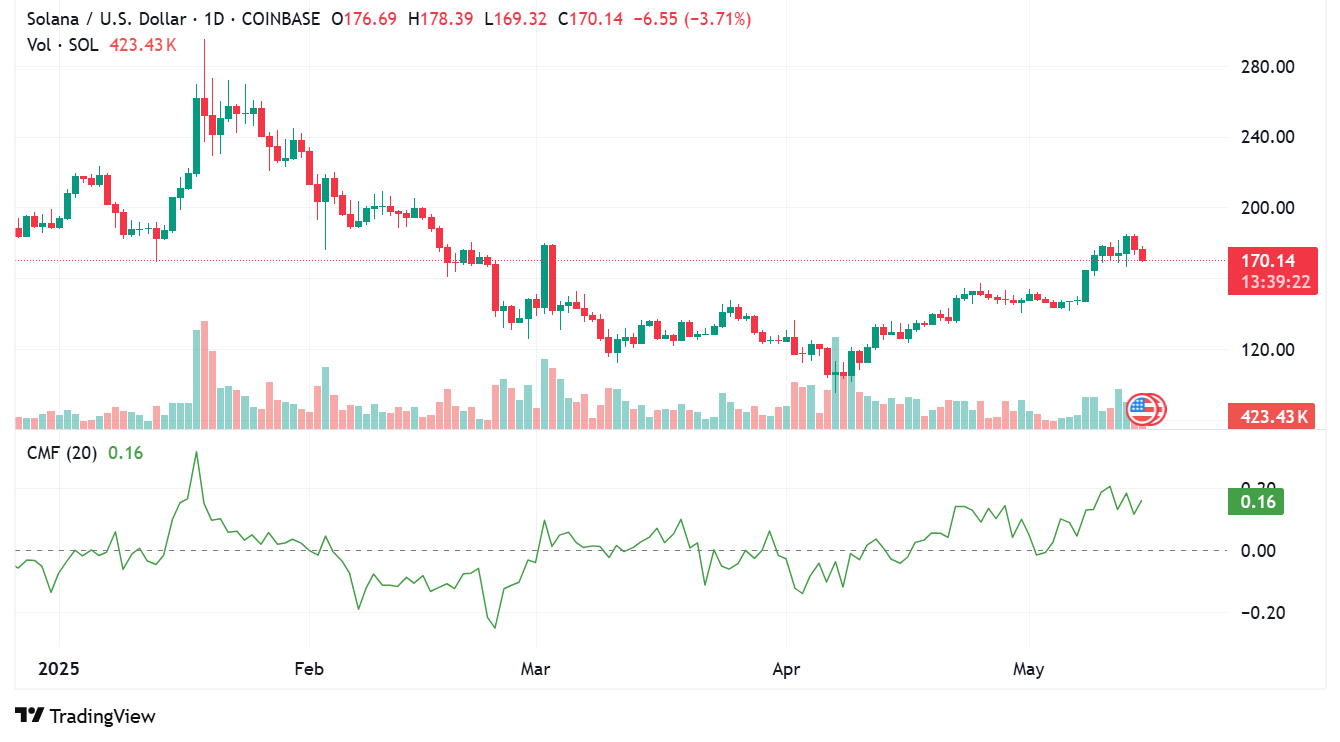
Since mid-April, SOL has been creating a series of higher lows, a classic bullish pattern showing growing demand at each successive price level.
The current consolidation around $170 represents a 42% bounce from April lows, potentially setting up continued upward momentum if realized cap metrics keep improving.
Following the smart money
Realized capitalization is particularly valuable for tracking actual capital movements since it weighs each unit of cryptocurrency by the price when it last moved.
SOL’s extended negative realized cap change from February through April showed capital flowing out or new investment drying up, while the recent uptick suggests fresh money moving in.
This shift aligns perfectly with SOL’s price stabilization and recovery over the past month. The timing of this realized cap reversal, coming after nearly three months of underperforming XRP, points to a potential sentiment shift toward Solana.
Strong technical structure forming
The daily chart showed SOL has established solid support in the $150-160 range, a zone that previously acted as resistance during April’s recovery. This price action, combined with improving realized cap metrics, creates a favorable technical setup for potential upside.
Immediate resistance sat at $185, marking April’s high. A break above this level, backed by continued realized cap improvement, could open the path to the $200 psychological barrier and potentially challenge February highs around $220.
What to watch
Based on realized cap comparison and price structure, Solana appears to be transitioning from underperformer to potential outperformer versus XRP. Traders should watch whether this positive divergence continues and if SOL can hold above the established $150 support.
The realized cap metric will be crucial over the coming weeks. Continued improvement strengthens the bullish case, while any reversal back to negative territory might suggest insufficient conviction behind the recovery.
With improving capital flows now visible in the data, Solana has built the technical foundation for a potential sustained Q2 2025 recovery.
We're sorry you did not find what you were looking for. Please select the reason this article was not helpful.

