
Shiba Inu Decline: What Next For $SHIB After Recent 17% Drop?

Shiba Inu has fallen about 17.75% and now trades at $0.00001439, consolidating near a key Fibonacci and volume-profile support at $0.00001435 after rejection from the $0.00001600 area.
- Technical picture: Short-term downtrend with resistances near $0.00001638–$0.00001764, immediate support $0.00001435 and critical support $0.00001357.
- Derivatives & volume: Open Interest slid from ~ $273m to ~$210m while volume remained steady, implying reduced bullish exposure and a consolidation phase.
- Trading thesis: A break above $0.00001560 with rising volume would revive bulls; failure to hold $0.00001435 could trigger a move toward $0.00001357.
Shiba Inu’s (SHIB) decline has continued after experiencing a significant 17.75% drop over the past nine days. Currently trading at $0.00001439, the meme coin has declined by over 1% in the last 24 hours.
Recent price action
The downward movement began after SHIB reached a local high of $0.00001707 in early May. Since then, the token has formed a clear downtrend, with each subsequent bounce failing to establish higher lows.
The price chart shows a recent rejection from the $0.00001600 resistance level, with sellers maintaining control through consistent bearish pressure.
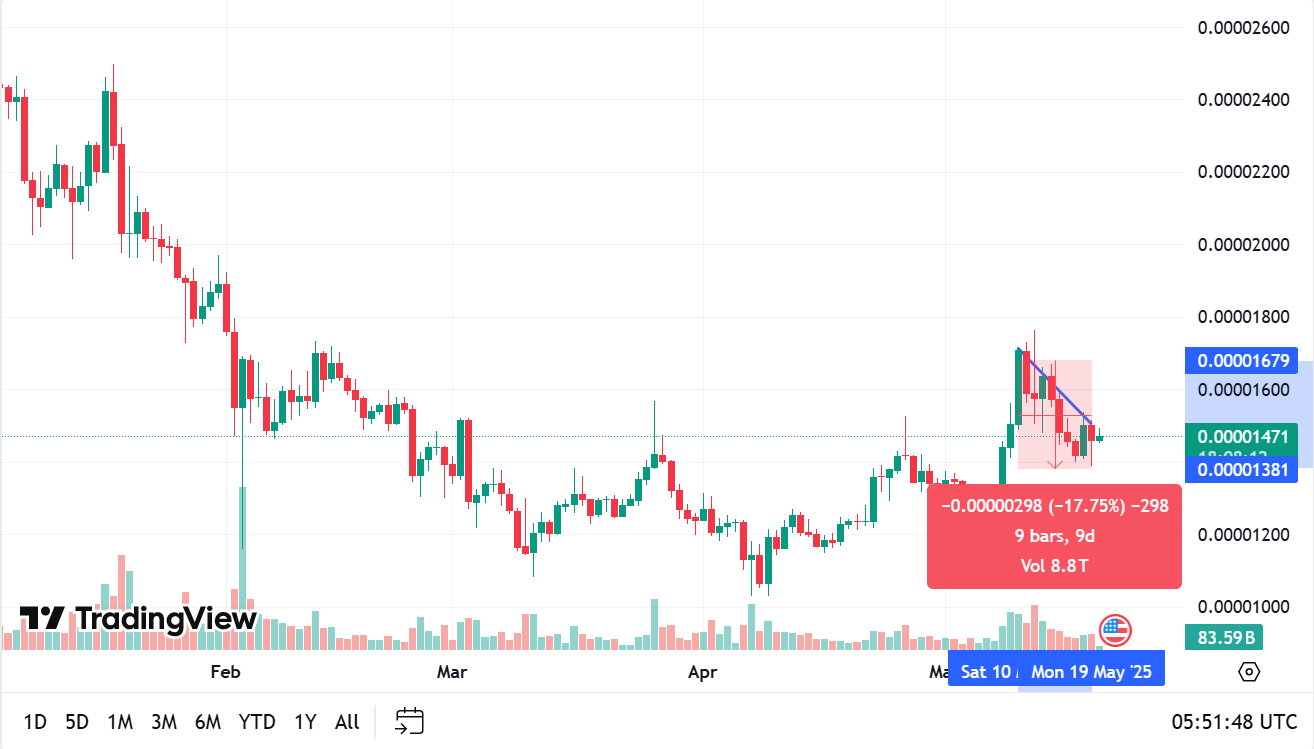
The most recent price action shows SHIB currently trading at $0.00001439, having bounced off the $0.00001435 support level identified in the Fibonacci Zone indicator.
This level is key for SHIB, as it has previously served as both resistance and support throughout April.
Technical indicators
The Volume Profile indicator displayed on the chart reveals significant price interest around the $0.00001435 level, suggesting a zone where buyers and sellers have historically been active.
The trend of the Fibonacci support and volume profile creates a strong foundation for temporary price stabilization.
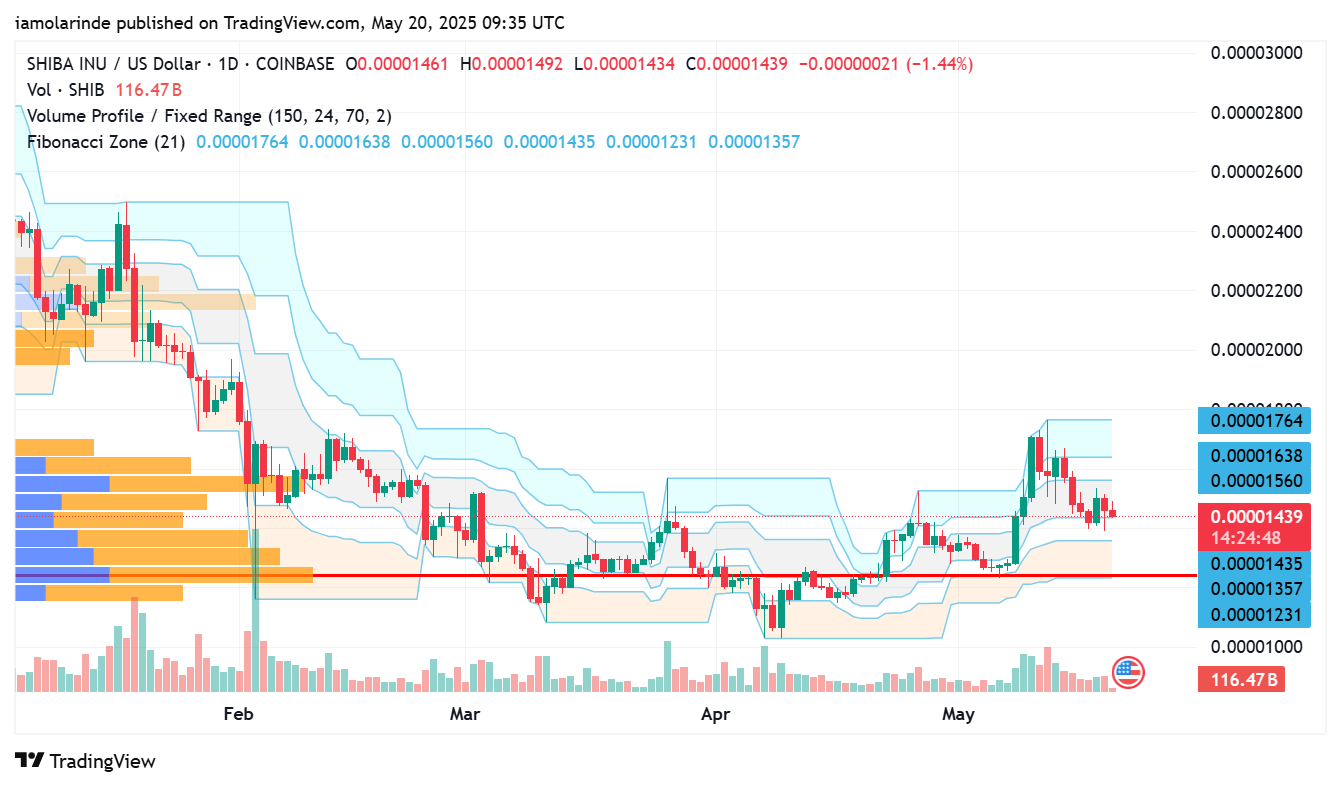
Current trading volume stands at 116.51 billion SHIB, which represents typical market activity for the token. The volume has remained relatively consistent throughout this correction without showing panic-selling spikes that would typically accompany more severe downtrends.
The Fibonacci Zone indicator highlights several key levels:
- $0.00001764: Recent high and first resistance
- $0.00001638: Secondary resistance
- $0.00001435: Current support
- $0.00001357: Critical support below current price
Derivatives show similar patterns
The derivative chart, displaying Open Interest and price, provides context for SHIB’s market structure. Analysis shows it has closely tracked price movement throughout 2025. Open Interest represents the total number of outstanding derivative contracts.
Notably, the recent May price surge coincided with an increase in Open Interest, which peaked near $273million before beginning to decline alongside price.
This parallel reduction suggests derivatives traders are reducing their exposure to SHIB, potentially indicating diminishing bullish sentiment in the short term.
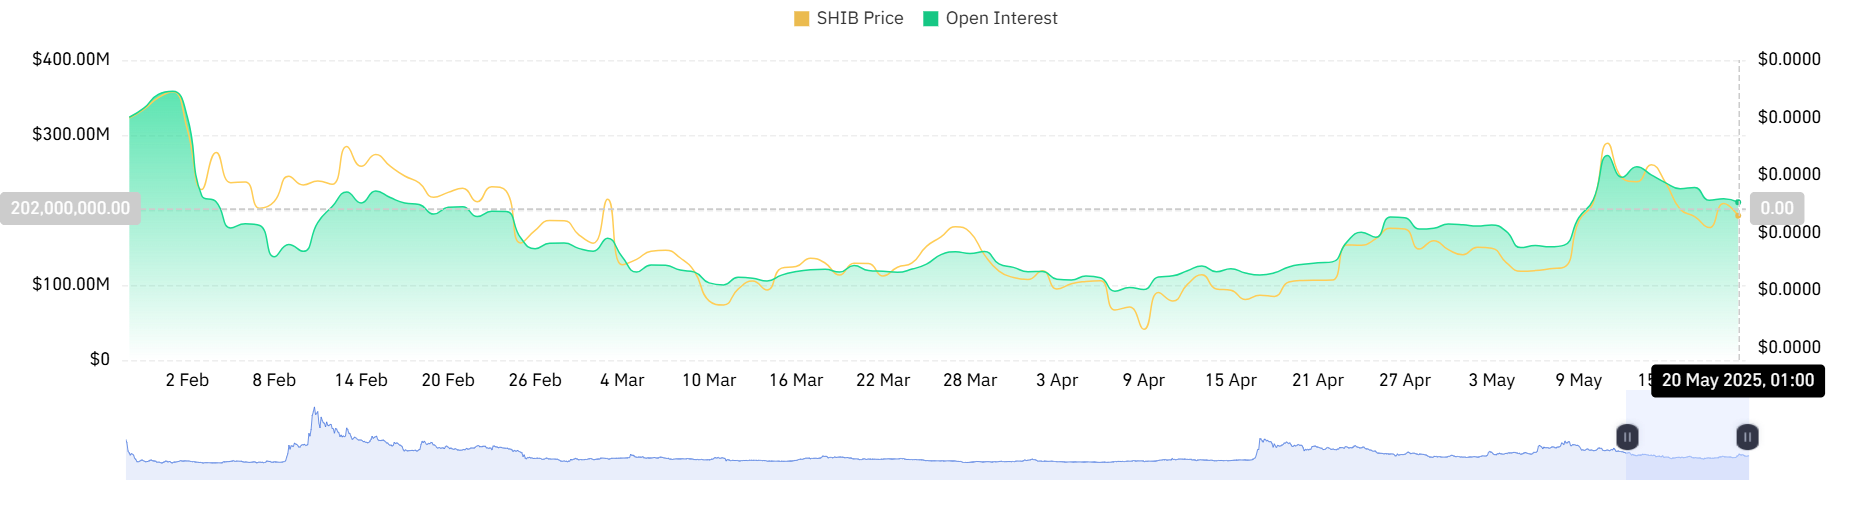
Currently, Open Interest has stabilized around the $210m mark, suggesting that aggressive unwinding of positions has concluded. This stabilization often precedes a period of price consolidation.
Where Shiba Inu could go from here
SHIB’s current position at $0.00001439 places it in a technical situation. The meme coin is trading above immediate support but remains in a clear short-term downtrend. For bullish momentum to resume, SHIB would need to break above the $0.00001560 resistance level with increased volume.
Conversely, a failure to hold the $0.00001435 support could trigger additional selling pressure, potentially sending SHIB toward the lower Fibonacci support at $0.00001357.
With derivative activity cooling and price consolidating near established support, SHIB is searching for direction following its significant correction from May highs.
We're sorry you did not find what you were looking for. Please select the reason this article was not helpful.

